p<0.5 and the need for Causal AI
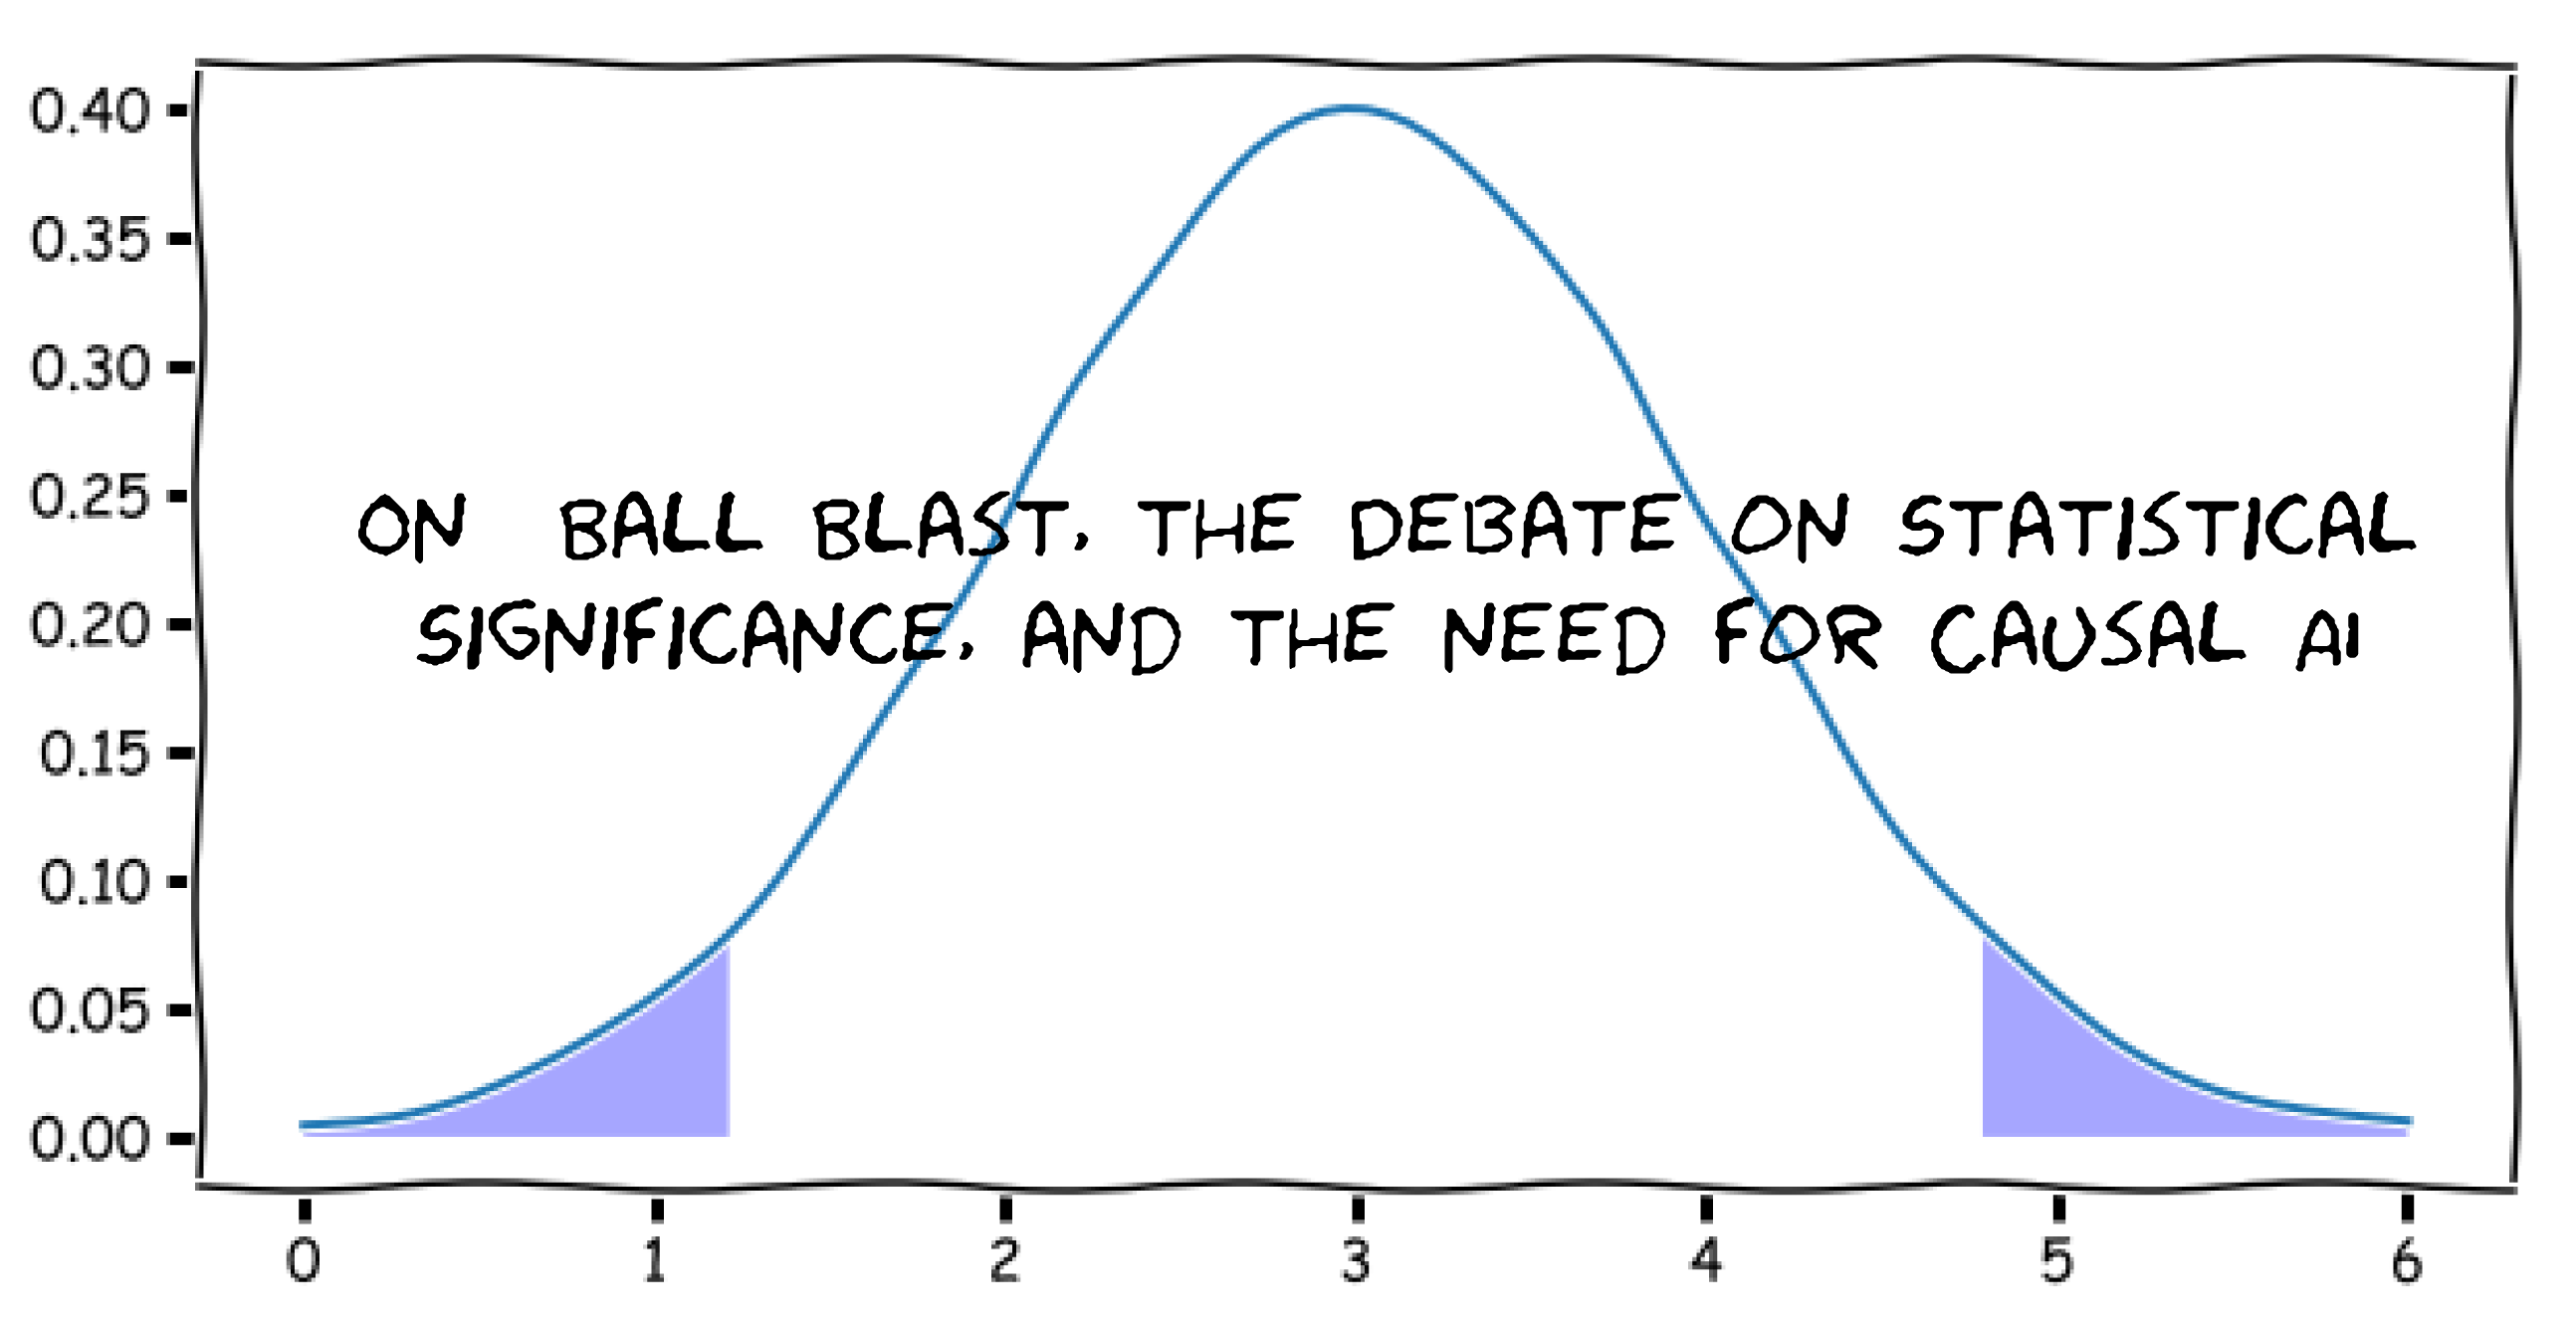
First things first. Yes, as is evident from the cover for the article, matplotlib now supports an xkcd mode, with 'sketched' graphs and figures. The Humor Sans font can be used to complete the effect.
Statistical inference is the cornerstone which most of statistical theory rests on. It involves statistical analyses, coupled with the usage of evidence and reasoning to draw conclusions or deductions.
Given the data that one owns, one can propose a hypothesis as a starting point for their investigation. This, in turn, might lead to further experimentation, measurement, and postulation. But where does it stop? We assume that the data we have is a small population drawn from a larger population, allowing us to make claims about the underlying probability distributions of that larger population. We finally give a proposition, to substantiate our claims of what the larger probability distribution is like. We shall be using methods of Statistical Inferencing in this article.
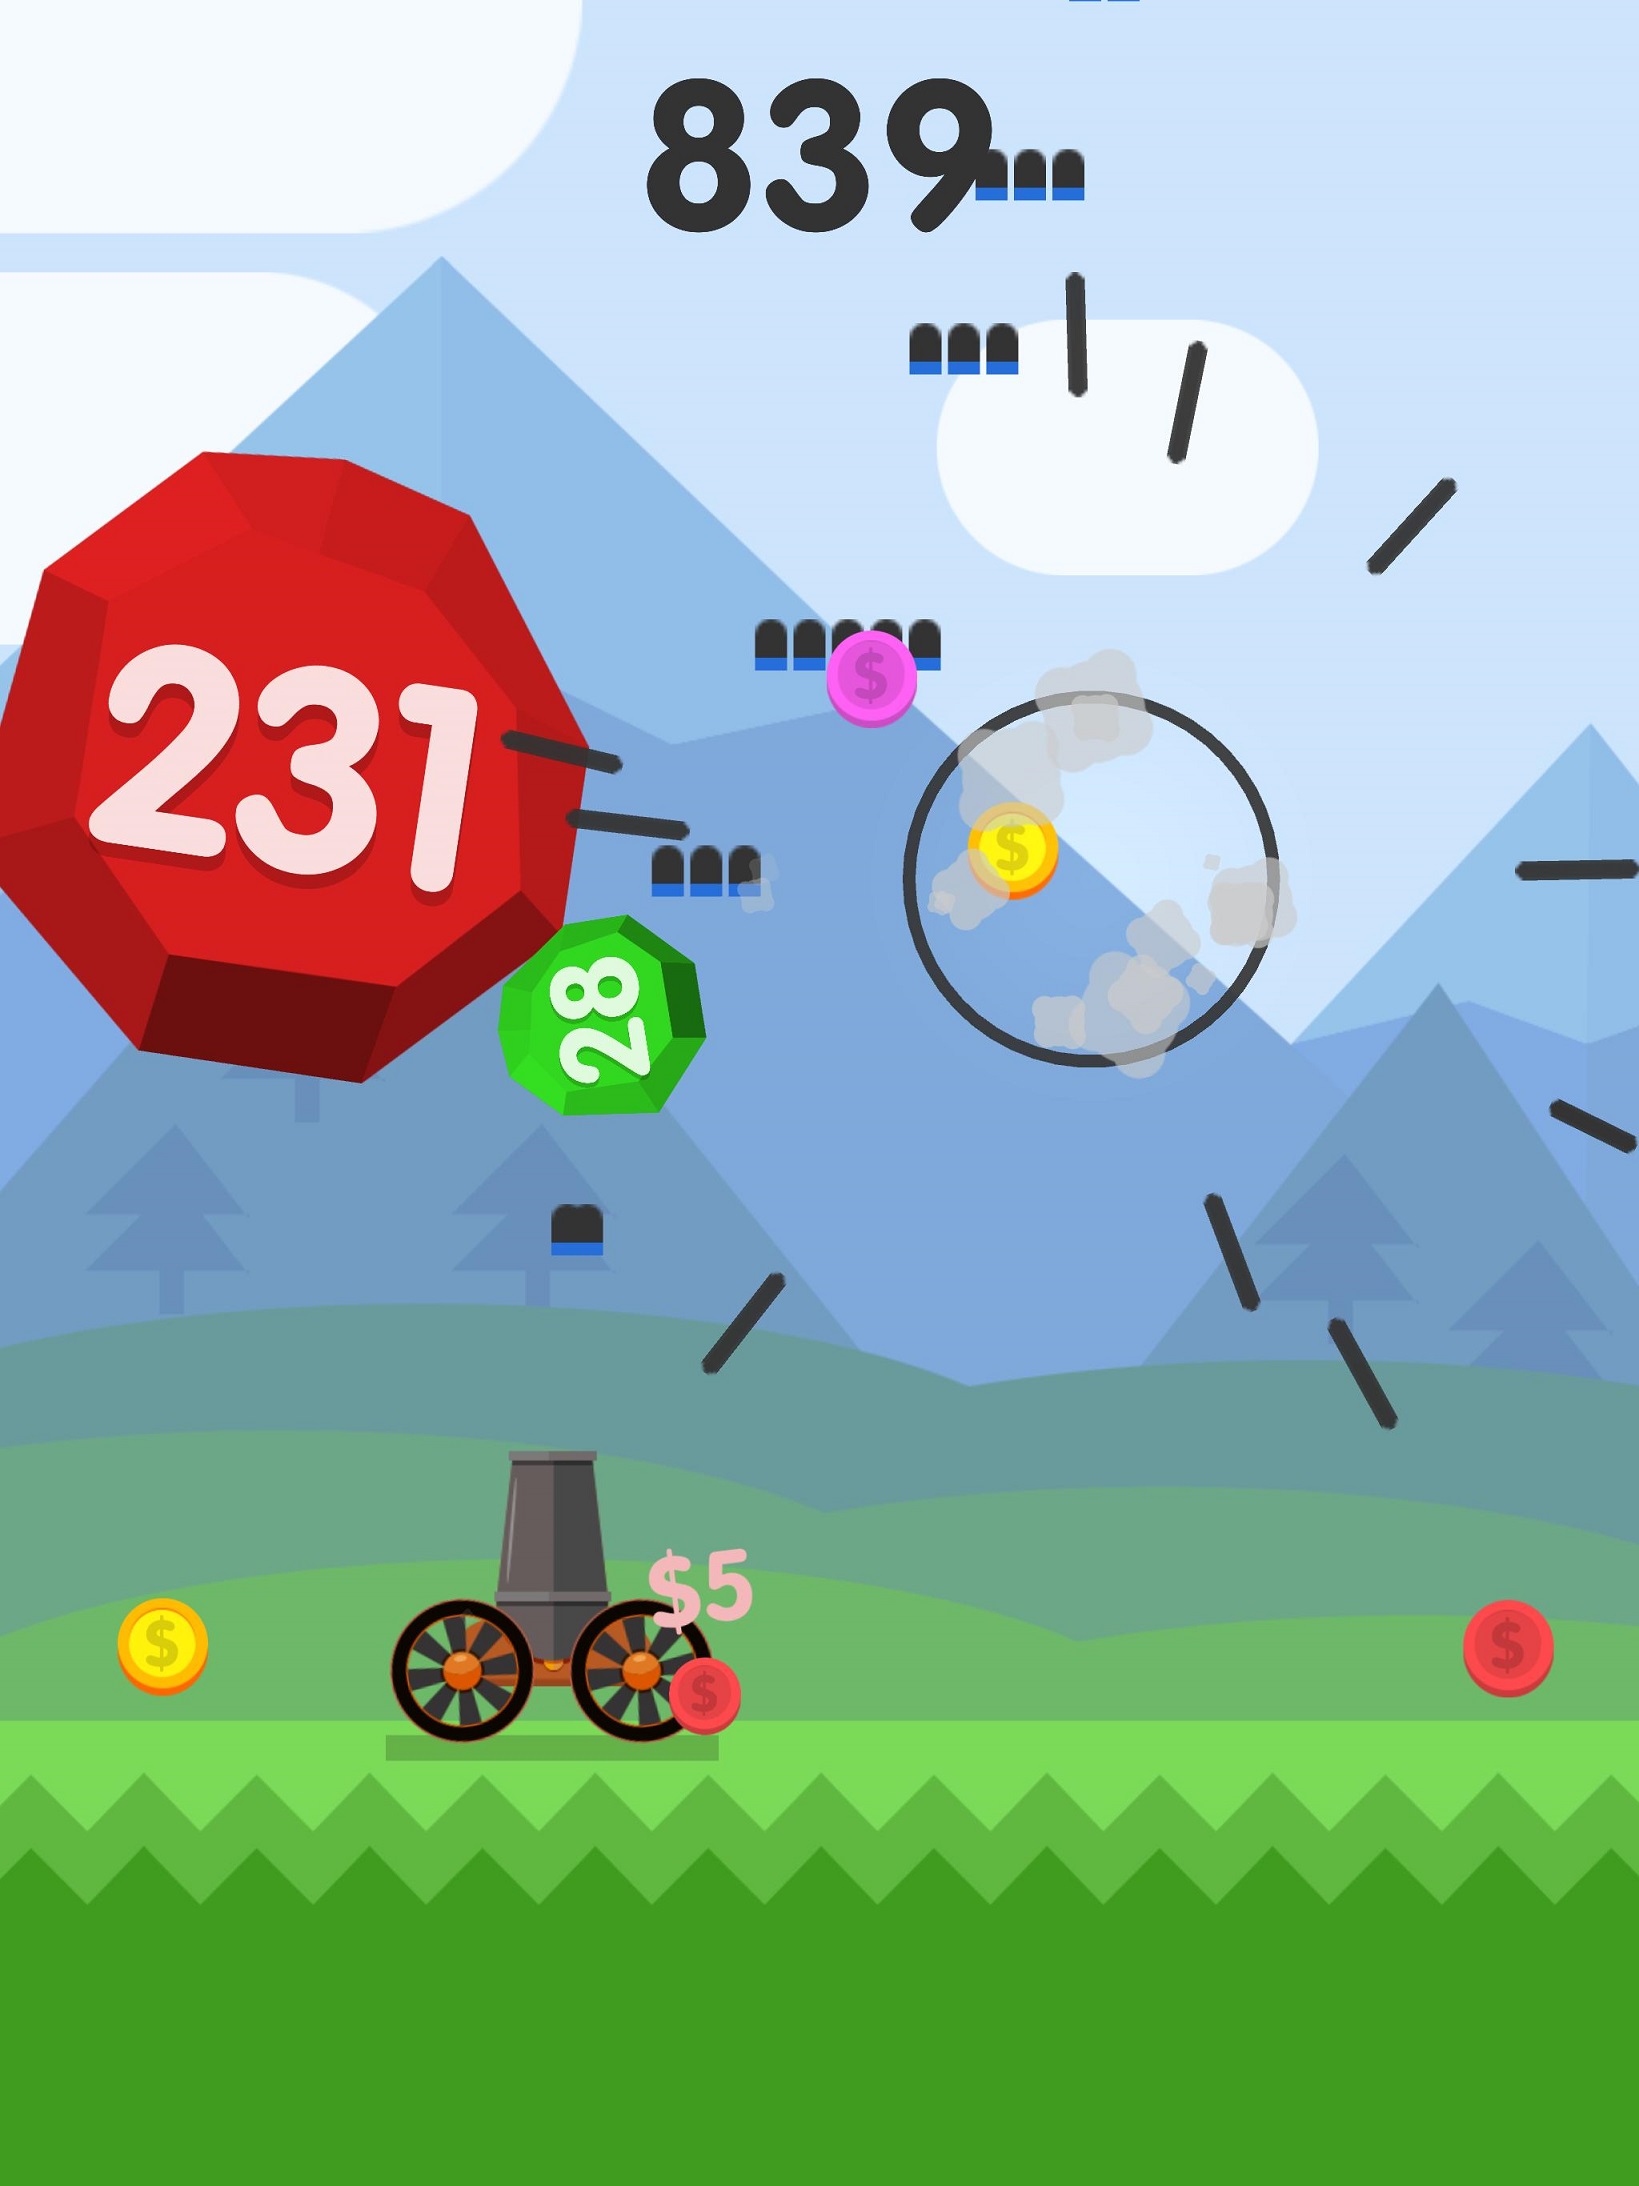
Ball Blast
Massively popular mobile game studio Voodoo released 'Ball Blast' in 2017 and I've been hooked. Voodoo might not be a household name but their Instagram & Facebook - centric advertising method has been working wonders for them, with their collective app downloads reaching 2.1 billion. But that's enough about Voodoo, let's get back to Ball Blast.
Reminiscent of Miniclip's 2000's game Bubble Trouble, Ball blast is a simple arcade game, the objective being to shoot down bouncing boulders and surviving as long as possible.
You earn coins normally by destroying the boulders, which can then be used to buy in-game permanent upgrades. Sometimes, breaking these boulders drops one of four available power-ups; temporary invincibility, increased firepower and so on. One of these power-ups is Sack-o-cash, it grants the player a large chunk of money. Having reached level 80, I got bored and started experimenting with the game. I started hoarding coins and stopped spending entirely. By the time I'd saved up a good amount of money, I perceived an increase in the number of times the boulders dropped up the Sack-o-cash power-up. Weird.
Since I wasn't upgrading anymore, I found it harder to play and advance any further levels and finally, got stuck on a particular level (Level 93). I hypothesized that since I had been stuck on the same level, the game assumed that I was broke, and to incentivize spending on upgrades, it was dropping the Sack-o-cash disproportionately frequently. This way, I would have tons of money to spend on upgrades, I would keep advancing levels, having fun, and wouldn't give up on the game entirely. It seemed like a reasonable hypothesis to me, that the game must have been designed with an adaptive difficulty level. The developers must have coded their game this way, how else would this game have reached 37 million downloads and such high engagement rates? I decided to test this hypothesis.
Statistical Significance
Statistical hypothesis testing involves framing a null hypothesis & an alternative hypothesis followed by tests to prove their significance upto a certain threshold. The null hypothesis is tested on the basis of observing a process that is modeled via a set of random variables.
Note: We follow the approach in Testing Statistical Hypotheses by Erich Lehmann et al. in our testing.
In our case, our hypotheses are:
- H0 Null Hypothesis: The developers made no provisions for people stuck on a level, the game doesn't award them disproportionately more Sacks-o-cash to advance their level.
- H1 Alternative Hypothesis: The developers made provisions for people stuck on a level, the game awards them disproportionately more Sacks-o-cash to advance their level.
Since we can't just look under the hood directly and see for ourselves if the developers have made such an arrangement, we are trying to use statistical methods to determine if there really is a relationship between the increased Sack-o-cash drop rate and player being stuck on a particular level. We start by collecting data for this scenario, when a player is stuck on a level. Call this dataset, D1. We collect a control dataset in which the player has been regularly upgrading and advancing levels. Call this dataset, D2. By comparing the two datasets against each other, we shall test the null hypothesis.
In our case, our datasets are:
- D1: The dataset for when the player has been stuck on a particular level.
- D2: The dataset for when the player is upgrading and completing levels on a regular basis.
I followed this process during said data collection:
- Stuck on the same level (Level 91)
- If the player dies before taking the drop from a boulder, the data is discarded
- The player dies right after collecting the first drop
- Internet is turned off during the collection
- No upgrades are purchased
The dataset that I ended up with had the following metrics:
| Dataset | Number of instances | Mean | Standard Deviation | |||
|---|---|---|---|---|---|---|
| D1 | 200 | mean | std | |||
| D1 | 150 | mean | std |
Our null hypothesis argues that there's no difference between the two datasets. We check these claims using the Welch t-test, an adaptation of the Student t-test.
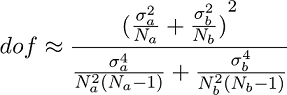
The Welch t-statistic and degrees of freedom(dof) are given by:
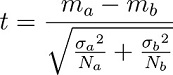
where the "sigma's" are the standard deviations,
the "N's" are the number of instances,
and the "m's" are the means
Using values from our datasets, we get a resulting t-statistic value of <2.39> and dof of
This results in a p-value of <>
We can now choose a suitable significance level to reject our null hypothesis :D.
Let it be <0.5>, thus our p-value is less than our significance level and hence we reject the null hypothesis.
The hypothesis H1 is statistically significant.
The Debate on Statistical Significance
How we misrepresented and embroidered the analysis in the last part, brings into light the entire controversy and debate surrounding statistical significance in the scientific community. David Bakan, an outspoken American psychologist, often wrote about doing away with statistical significance, "the test of statistical significance in psychology research may be taken as an instance of a kind of essential mindlessness in the conduct of research," and Coronach claimed that "the time has arrived to exorcise the null hypothesis."
Cronbach and Snow (1977) outline the first problem, the differences between the correct interpretation and the layperson's.
A p value reached by classical methods is not a summary of the data. Writers and readers are all too likely to read 0.05 as p(H|E), the probability that the Hypothesis is true, given the Evidence. Textbooks reiterate, in vain, that p-value is p(E|H), the probability that this Evidence would arise if the [null] hypothesis is true.
Nunally et al. (1975) describe the second problem, one of reproducibility. Paraphrased:
Statistical significance at the 0.05 level corresponds to a 95% confidence that the observed difference will hold up in future investigations with similar set-ups.
The third problem relates to the research hypothesis being valid.
Even if the null hypothesis is rejected, other competing hypotheses have to be rejected too before we can claim our own research hypothesis to be true.
Although these points are valid, the moderate position claims multiple solutions, some being:
- Statistical significance is still useful in determining if a certain observation is worth investigating.
- It is grounds enough for trying to replicate results.
- Fields set limits on significance, like particle physicists expecting a 5-sigma level for the Higgs Boson.
- Investigations independent of statistical tests are carried out to supplement evidence for the hypothesis.
Some in the scientific community are more vocal and have already acted on the 'menace' that is statistical significance testing. Basic and Applied Social Psychology journal has banned the use of significance testing altogether. Journals have started rejecting papers for misreporting 'statistically significant' as 'significant'. Ronald Carver would be proud.
The Need for Causal AI
The speed of recent advancements in the field of Artificial Intelligence has left everyone in awe of its adoption rate amongst researchers from diverse fields. Being used in all forms of research - language, art, psychology, medicine, and numerous other practical fields, AI has become something we heavily depend on, in our tools and implements, and articles of convenience.
Here's a field where the timescales of new breakthrough advancements and improvements are mere months, a far cry from the scale of years that most other fields work with. Considering this scale of months, there's an appreciable lag in the timelines for new AI models and the tools we develop to understand the blackboxes that some of these models are. Take for example the invention of the CNN and us developing the tools to understand CNNs on the convolutional filter level. We are okay with putting our lives in the hands of these complicated, correlation-making, curve-fitting models. This is not to say these associative models aren't useful, but there is a real need for causal AI models that establish a cause-effect relationship between variables.
Refer to this article where Judea Pearl makes a stronger case for Causal AI than can be ignored. Pearl argues that causal reasoning can enable machines to better communicate with humans and even become moral entities with an inherent capacity for free will or even evil. This is our best bet for building AGI, we need models that don't work on superficial correlation tasks but instead identify the underlying causal mechanisms.
Mathematics has not developed the asymmetric language required to capture our understanding that if X causes Y that does not mean that Y causes X. It sounds like a terrible thing to say against science, I know. If I were to say it to my mother, she’d slap me.
The man sure has flair.
Note: After much thought, the number of alliterations in this article has been restricted to 1. "Bouncing boulders".